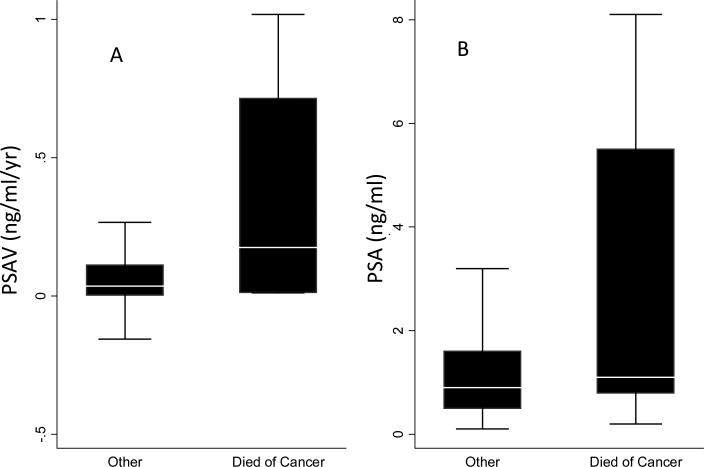
Fig. 3.
Distributions of PSAV levels and PSA at the transition point for men who did and did not die from prostate cancer. (A) Distribution of PSAV; (B) Distribution of PSA levels. Boxes represent the 25th to 75th percentiles (IQR); horizontal lines within boxes are the median values; vertical lines are 1.5 times the IQR (outliers of > 1.5 times the IQR were removed from illustration).

