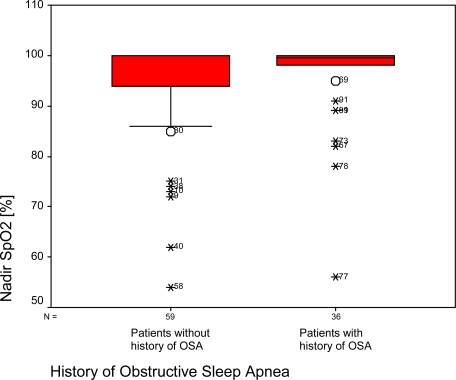
Fig. (2).
Nadir peripheral oxygen saturation (SpO2) during induction of anesthesia. Box plots of quartiles (boxes), median (line within box), 10th, and 90th percentiles (error bars, outliers’ ID is given as open circles). Median of nadir oxygen saturation is significantly higher in patients with a history of OSA.

