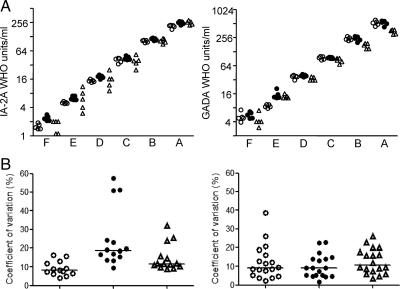
Figure 2.
Calibration of NIDDK calibrator samples. A, NIDDK calibrators A to F (abscissa) were tested together with the WHO reference preparation for IA-2A and GADA using the harmonized assays on five separate occasions in the Munich (open circles), Bristol (filled circles), and Denver (open triangles) laboratories to determine their WHO units/ml equivalents. The calibrated WHO units/ml for each of these measurements are shown. The median of the WHO units/ml was used to assign DK units/ml to the NIDDK calibrators. B, A set of coded samples that included 18 samples from patients with type 1 diabetes were also included in the calibration exercise. Each set was tested together with NIDDK calibrator samples on five occasions. Using calibration curves of the NIDDK calibrators, DK units/ml were assigned to each of these samples. For each laboratory, the coefficients of variation of the five replicate measurements for each of these samples are shown for IA-2A with values greater than 2.5 DK units/ml (left; n = 14 samples) and for GADA with values greater than 2.5 DK units/ml (right; n = 18 samples) for each of the laboratories. The median coefficient of variation for the sample is shown in each laboratory by the horizontal line.

