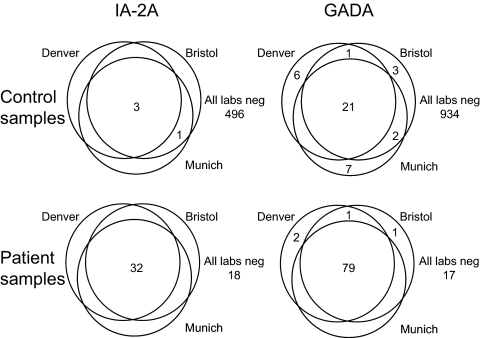
Figure 4.
Venn diagram showing concordance of IA-2A (left panels) and GADA (right panels) in the Munich, Bristol, and Denver laboratories on control samples (upper panels; n = 500 for IA-2A, n = 974 for GADA) and patient samples (lower panels; n = 50 for IA-2A, n = 100 for GADA). Numbers refer to the number of positive samples.

