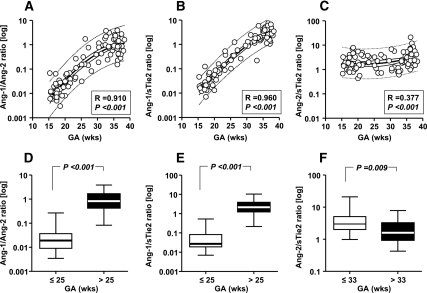
Figure 2.
Ratios of AF Ang-1/Ang-2, Ang-1/sTie2, and Ang-2/sTie2 in pregnancies with normal outcomes (n = 104). The best-fitted equations corresponded to second-order nonlinear interpolations of log-transformed AF levels of each ratio, which resulted in significant direct correlations with GA. A, Ang-1/Ang-2 ratio; B, Ang-1/sTie2 ratio; and C, Ang-2/sTie2. The two-step clustering analysis identified different GA cutoffs between samples with low vs. high ratio levels. Ang-1/Ang-2 (D) and Ang-1/sTie2 (E) ratios were low before 25 wk gestation, increasing thereafter. The GA at which the Ang-2/sTie2 ratio (F) decreases significantly was identified at 33 wk. Data are presented in logarithmic format. A–C, Thick lines, second-order regression line; thin continuous lines, 95% CI; dotted lines, 95% prediction intervals. D–F, Ends of the boxes, 25th and 75th percentiles; line inside the box, median; whiskers, largest and smallest values.

