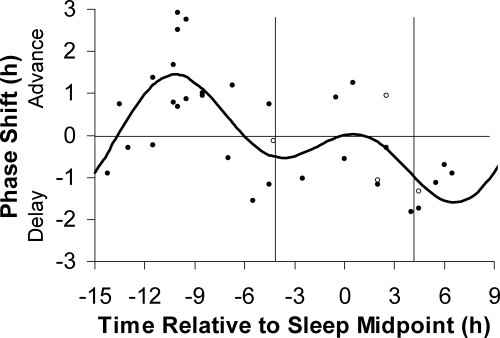
Figure 3.
The three-pulse PRC to 0.5 mg of exogenous oral melatonin generated from subjects free-running during 3 d of an ultradian light/dark cycle (LD 2.5:1.5). Phase shifts of the circadian clock, measured by the DLMO, are plotted against the time of administration of the melatonin pill relative to the midpoint of each individual’s assigned baseline sleep schedule at home from before the laboratory sessions. The vertical lines represent the average assigned baseline bedtime and wake time. Each dot represents the phase shift of an individual subject, calculated by subtracting the phase shift during the placebo session (free-run) from the phase shift during the melatonin session. The open circles represent the four women who had varying hormone levels during the study due to the use of hormonal birth control. The curved line illustrates the dual harmonic curve fit.

