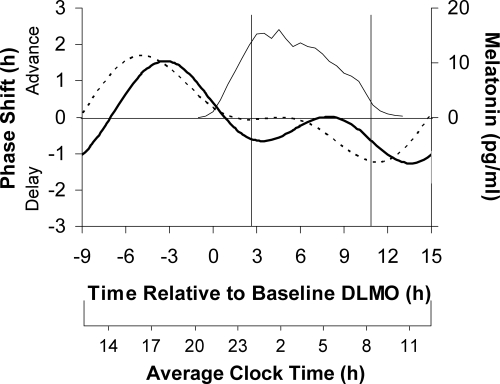
Figure 4.
The dual harmonic curve fits to the three-pulse PRC generated to 0.5 mg of exogenous oral melatonin (solid curve) and to 3.0 mg of exogenous oral melatonin (dashed curve). Phase shifts of the DLMO (left y-axis) are plotted against the time of administration of the melatonin pill relative to the baseline DLMO (top x-axis). The average baseline melatonin profile (thin line, right y-axis) and the average assigned baseline sleep times from before the laboratory sessions (vertical lines) for both groups are shown. The average clock time axis (bottom x-axis) corresponds to the average baseline sleep times at home.

