Figure 1.
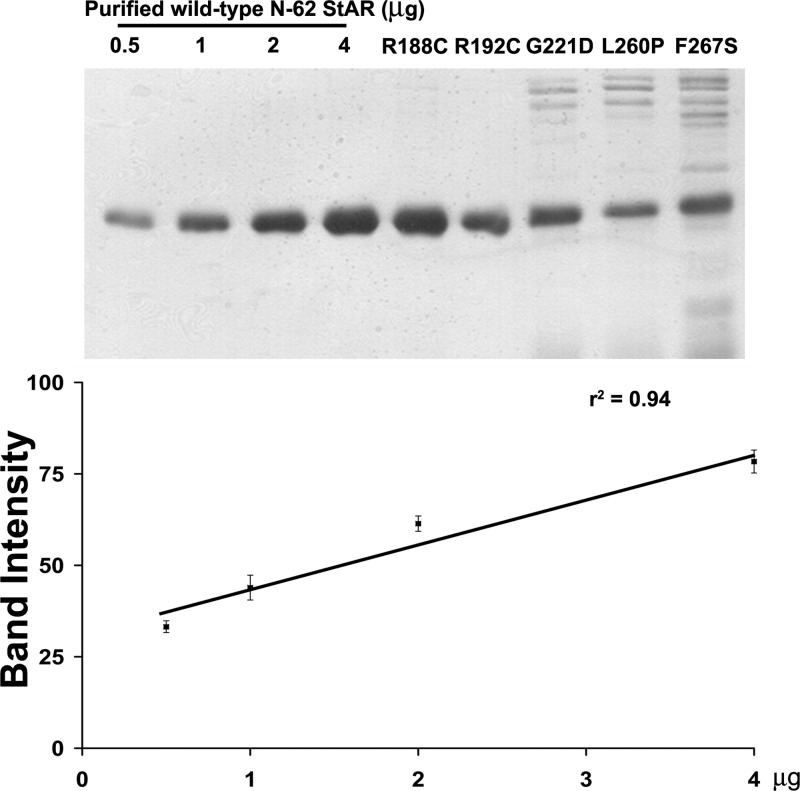
Quantification of StAR protein. Top panel, The indicated amounts of purified wild-type N-62 StAR protein and mutant purified N-62 StAR proteins were separated by 12% SDS-PAGE. The band intensity was measured by Scion Image software. Bottom panel, The standard curve of StAR protein. The amount of mutant N-62 StAR proteins was plotted against its band intensity.

