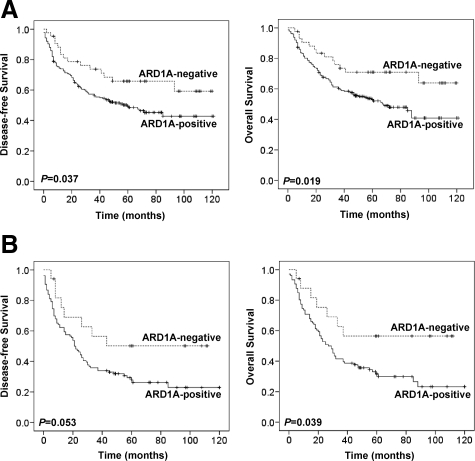
Figure 3.
DFS and OS of patients with colon cancer according to Kaplan–Meier analysis. A: Kaplan–Meier survival curves for DFS (left panel) and OS (right panel) indicate that ARD1A-positive tumors are associated with a worse prognosis than ARD1A-negative tumors for patients with colon cancer. B: Kaplan–Meier survival curves for DFS (left panel) and OS (right panel) in node-positive patients indicate that ARD1A-positive tumors are associated with a worse prognosis than ARD1A-negative tumors for the node-positive patients.

