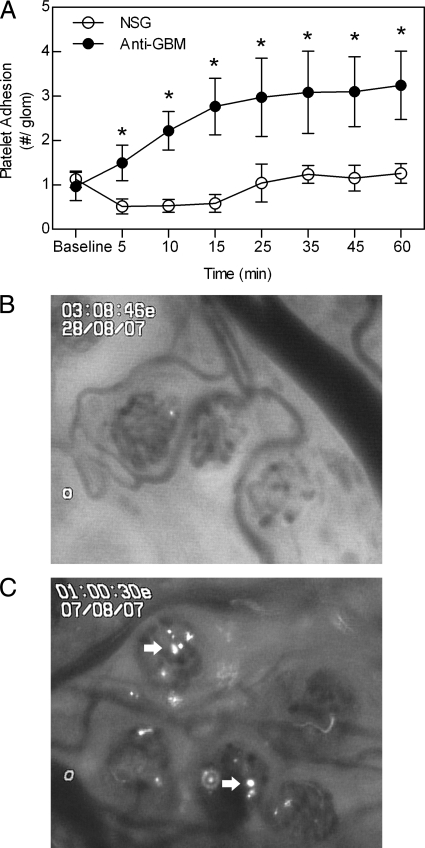
Figure 1.
Platelet accumulation in the glomerular microvasculature, as assessed using intravital microscopy. A: Glomerular accumulation of platelets was assessed via renal intravital microscopy, following i.v. infusion of 2 × 10⁸ CFSE-labeled platelets. After an initial recording of platelet accumulation, mice were treated with anti-GBM antibody or NSG (20 mg, i.v., n = 6 per group), and platelet adhesion assessed at various time points over the ensuing 60 minutes. Data are shown as mean ± SEM. *P < 0.05 versus NSG-treated groups for each corresponding time point. B and C: Captured images of the renal microvasculature in an NSG-treated animal (B), and following anti-GBM antibody administration (C). Adherent platelets (arrows) are visible in the anti-GBM antibody-treated animal.

