
Figure 11.
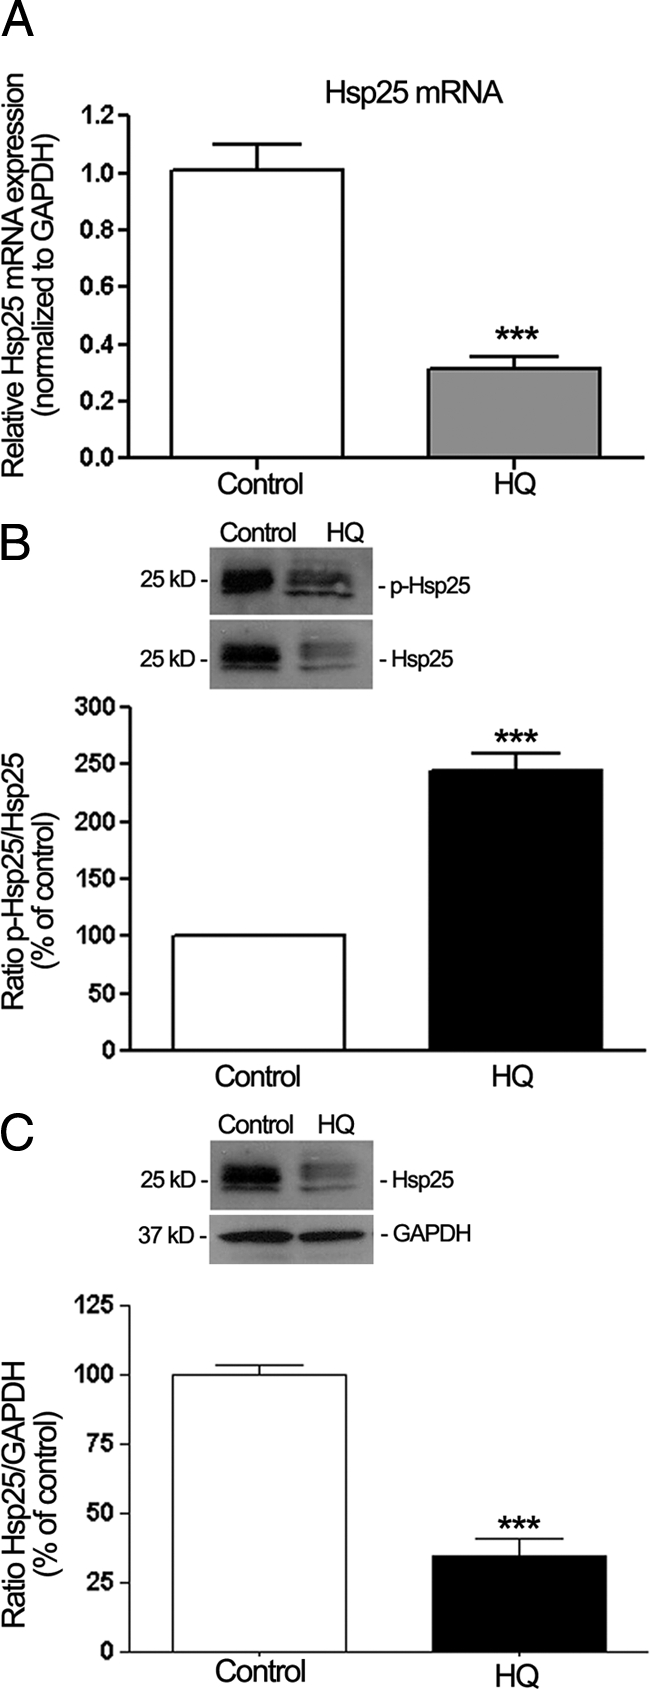
Regulation of Hsp25 and phosphorylated Hsp27 (p-Hsp25) in dissected RPE sheets from mice treated with HQ (0.8%) in drinking water for seven months. Protein and total RNA were extracted from RPE sheets (n = 6 eyes/group). A: Hsp25 mRNA expression analyzed by real-time PCR. GAPDH was used as the housekeeping gene. Data represent average results from six eyes normalized to the housekeeping gene. Results are expressed as mean ± SE. ***P < 0.001 versus control. B: Ratio p-Hsp25/Hsp25 protein expression evaluated by Western blot. Top: Western blot from a representative experiment. Numbers on the left represent protein molecular mass in kilodaltons. p-Hsp25 protein expression was normalized to total Hsp25 protein. Bottom: Data are the average results from six eyes. Data are expressed as percentage of control and shown are mean results ± SE. ***P < 0.001 versus control. C: Ratio Hsp25/GAPDH protein expression evaluated by Western blot. Top: Western blot from a representative experiment. Numbers on the left represent protein molecular mass in kilodaltons. Hsp25 protein expression was normalized to GAPDH. Bottom: Data are the average results from six eyes. Data are expressed as percentage of control and shown are mean results ± SE. ***P < 0.001 versus control.