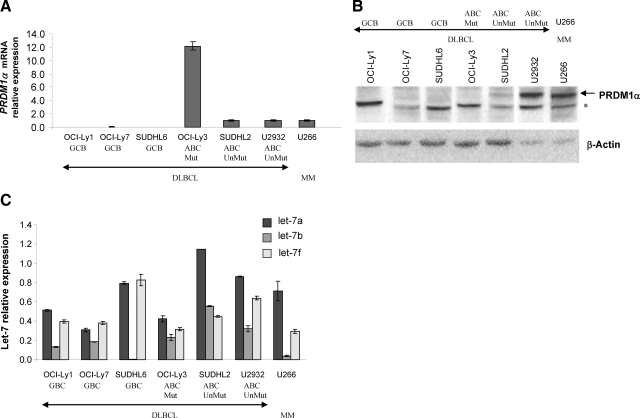
Figure 4.
Expression of PRDM1α and let-7 in DLBCL cell lines. A: PRDM1α mRNA expression by real-time PCR analysis in six DLBCL cell lines and the myeloma cell line U266. The levels were expressed relative to U266 (arbitrarily set as 1). The PRDM1α transcript detected in OCI-Ly3 was truncated because of a rearrangement in the PRDM1 gene. B: Western blot analysis of total cell extracts prepared from the above cell lines using the monoclonal antibodies against PRDM1. The nonspecific band is indicated by an asterisk. C: Expression of let-7a, let-7b, and let-7f in DLBCL cell lines and U266 (plasma cells = 1 for each let-7 species). For A, B, and C, the DLBCL subtypes and PRDM1 mutation status for the DLBCL cell lines are indicated.

