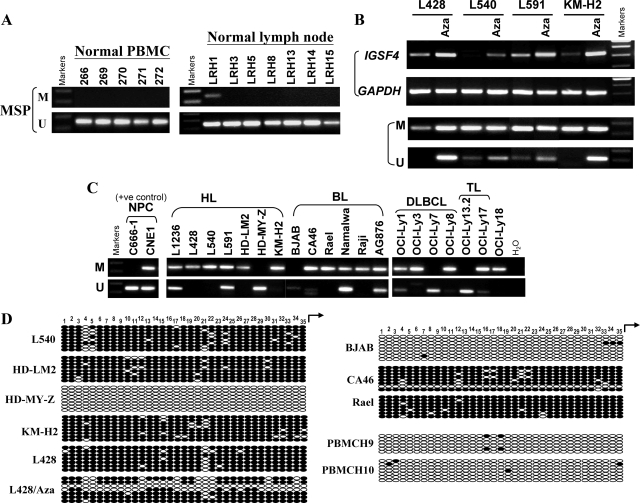
Figure 3.
Analysis of IGSF4 methylation in normal PBMC, normal lymph nodes, and lymphoma cell lines. A: By MSP, all PBMC and 6/7 nonmalignant lymph node samples showed only un-methylated IGSF4 promoter; one lymph node with weak IGSF4 methylation was detected. (M = MSP for methylated DNA; U = USP for unmethylated DNA). B: Up-regulation of IGSF4 mRNA with promoter demethylation by Aza treatment in HL cell lines (L428, L591 and KM-H2) with low levels of IGSF4 and L540 lacking IGSF4 expression. Upper panel shows RT-PCR analysis and lower panel shows MSP for methylation. C: MSP analysis of tumor cell lines. Loss or reduced IGSF4 expression was always accompanied by promoter methylation. NPC cell lines used as positive controls. D: Representative BGS methylation analysis in normal PBMC and lymphoma cell lines before or after Aza treatment. CpG sites are shown on the top row as numbers. Each row of circles represents a single allele of the IGSF4 promoter analyzed. Open circles: unmethylated CpG sites, filled circles: methylated CpG sites. IGSF4 was unmethylated in normal PBMCs (H9, H10) and cell lines expressing high levels of IGSF4 (examples shown are BJAB and HD-MY-Z). In contrast, IGSF4 was almost completely methylated in silenced cell lines (L540, HD-LM2, Rael, CA46, L428 and KM-H2). Promoter of L428 was partly demethylated following Aza treatment.

