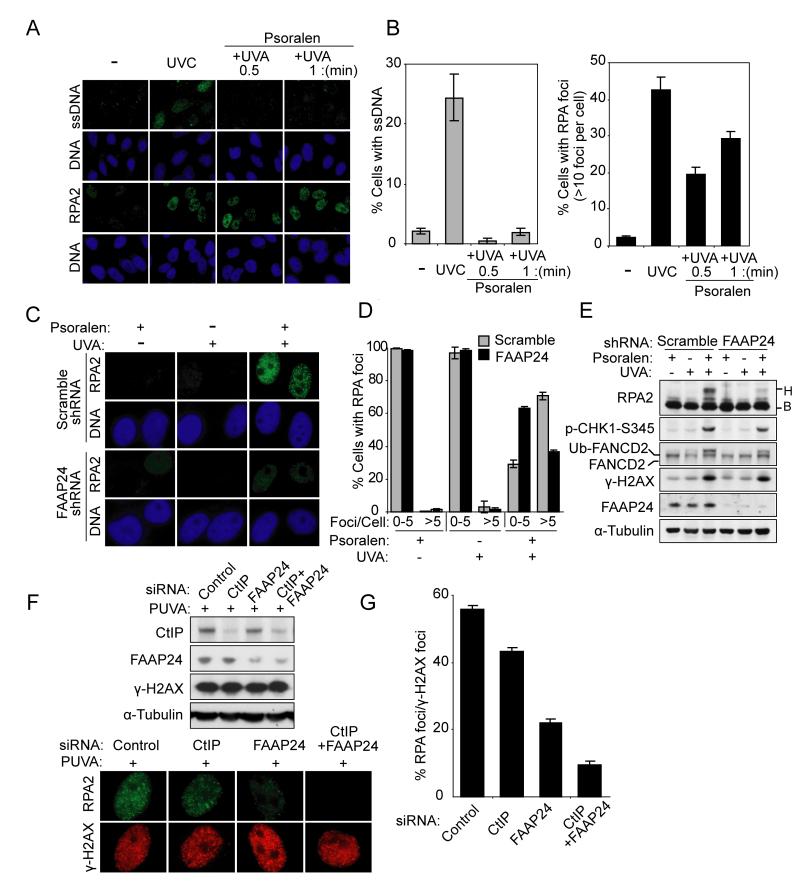
Figure 3. FANCM and FAAP24 are required for RPA foci formation and RPA2 phosphorylation following PUVA-induced ICL formation.
(A) Representative images of ssDNA staining and RPA foci showing that PUVA treatment induced RPA foci but not ssDNA. ssDNA and RPA foci were detected using anti-BrdU antibody or anti-RPA2 antibody 4 hr after PUVA treatment in HeLa cells. The immunostaining intensities are compared to those of UVC treatment. (B) Quantification of ssDNA staining and RPA foci shown in (A). The percentages of cells containing ssDNA (left panel) or cells containing RPA foci (right panel) were determined by counting at least 200 cells from each sample. Data are represented as mean ± SD from three independent experiments. (C) Representative images showing FAAP24-dependent RPA foci formation after PUVA treatment. RPA foci were detected in HeLa cells with scramble shRNA or FAAP24 shRNA 4 hr after PUVA treatment. (D) Quantification of RPA foci shown in (C). The percentage of cells containing RPA foci was determined by counting at least 200 cells from each sample. Data are represented as mean ± SD from three independent experiments. (E) Immunoblot showing reduced RPA2 phosphorylation in FAAP24-depleted cells. Cells were treated as described in (C). Different mobility of RPA2 caused by phosphorylation is indicated as “B” (baseline) and “H” (hyperphosphorylated), respectively. (F) Representative images showing that CtIP depletion resulted in a mild reduction in RPA foci compared to the depletion of FAAP24. HeLa cells were treated with PUVA at 48 hr after transfection with indicated siRNAs. Immunoblot showing the depletion efficiency of indicated proteins (upper panel). After co-staining with RPA and γ-H2AX, RPA foci formation was compared in CtIP-, FAAP24-, or CtIP- and FAAP24-depleted cells (lower panel). (G) Quantification of RPA foci formation shown in (F). The percentage of cells containing RPA foci among γ-H2AX-positive cells was determined by counting at least 200 γ-H2AX-positive cells from each sample. Data are represented as mean ± SD from three independent experiments.

