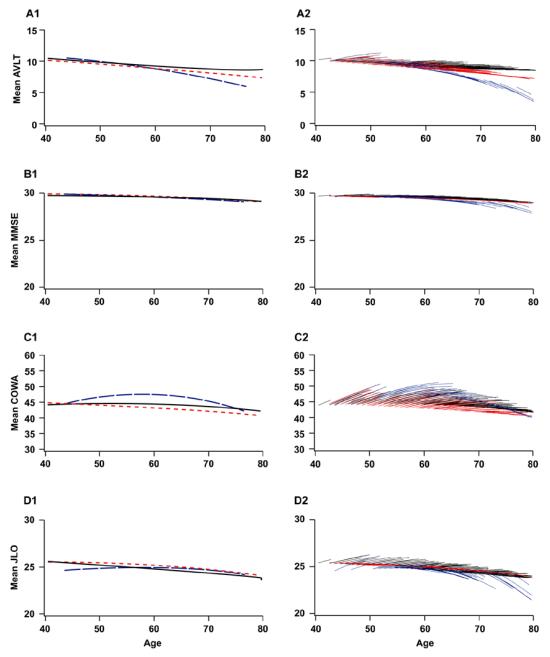
Figure 2.
Mean cross-sectional (1) and longitudinal trajectories (2) of the AVLT-LTM (A), MMSE (B), COWAT (C), and JLO (D) by ApoE e4 genotype (noncarrier vs heterozygotes vs homozygotes) based on the mixed model (Table 3). Cross-sectional means represent population mean values at the first examination. ApoE e4 noncarriers (solid black line), heterozygotes (dotted red line), and homozygotes (dashed blue line). Longitudinal mean trajectories are population mean trajectories for the ages at the first and followup examinations observed in the sample. Predicted values at the first examination and predicted trajectories for each subject in the sample (not shown) are vertically shifted from the displayed means via the random intercept term. APOE e4 noncarriers (black lines), heterozygotes (red lines), and homozygotes (blue lines).

