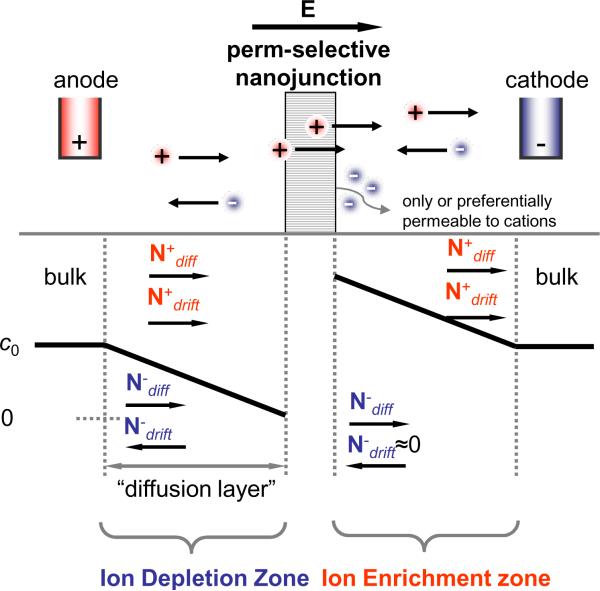
Figure 1.
Schematic diagram of ion concentration distribution at the front and back of a cation perm-selective nanostructure which only lets cations pass through. N+ and N− are the fluxes of cation and anion, respectively, and the subscripts diff and drift represent the diffusive and drift ion transport, respectively. E is the applied electric field across the membrane.

