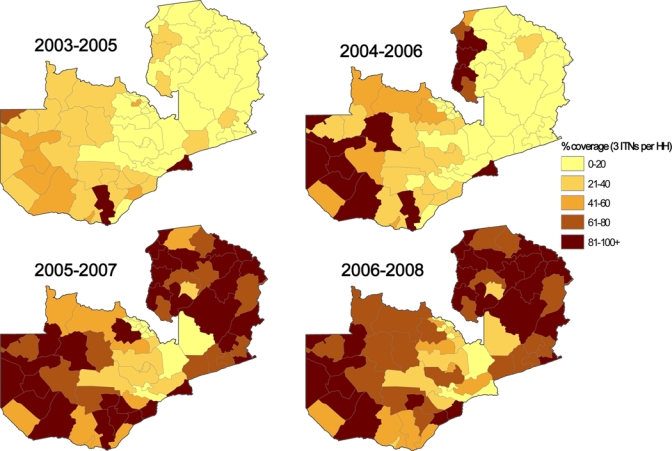
Figure 3.

Estimated operational coverage of 3 insecticide-treated mosquito nets (ITNs) per household in overlapping 3-year intervals based on ITN distributions by district in Zambia during 2003–2008. This figure appears in color at www.ajtmh.org.

Estimated operational coverage of 3 insecticide-treated mosquito nets (ITNs) per household in overlapping 3-year intervals based on ITN distributions by district in Zambia during 2003–2008. This figure appears in color at www.ajtmh.org.