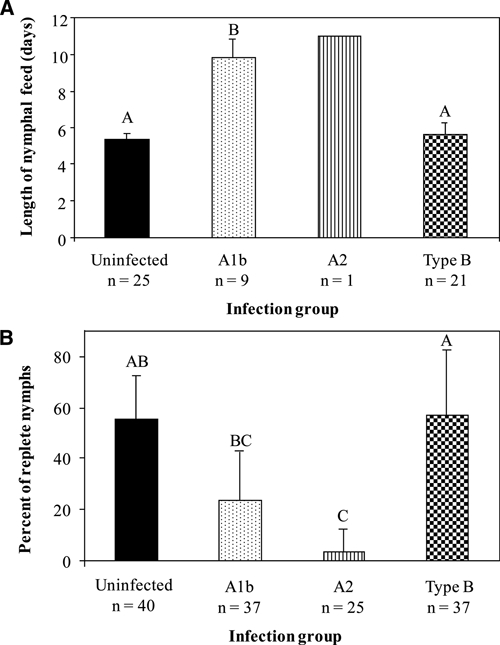
Figure 2.

Overall feeding success was compared for uninfected, A1b-, A2-, and type B-infected nymphal D. variabilis by examining (A) the mean number of days to feed to repletion and (B) the mean percentages of nymphs that fed to repletion. Error bars are the standard deviation in the length of feed for the group replicates (N = 4–6 groups). Sample size represents the number of ticks that were analyzed. Significant differences among F. tularensis infection groups determined by post-hoc pairwise Tukey–Kramer tests (P < 0.05) are indicated by differing letters above the columns.
