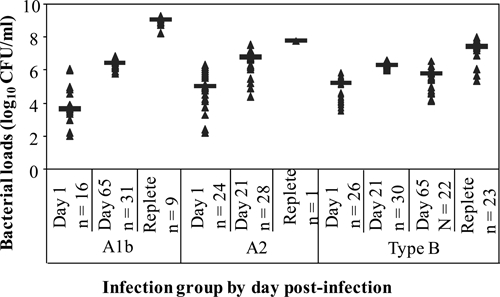
Figure 4.

Bacterial loads within A1b-, A2-, and type B-infected ticks 1 day after larval feeding (1 dpi), shortly after the larval molt (21 dpi), 1 day before the nymphal feed (65 dpi), and the day of nymphal drop-off. Each data point represents the bacterial load of one tick. The median of each group of measurements is represented by the black line.
