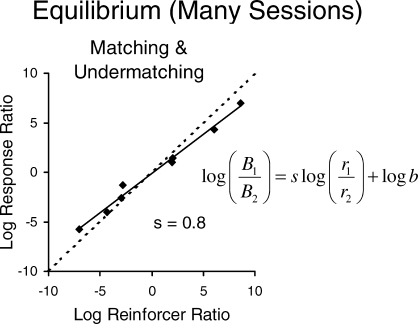
Fig 6.
The matching relation across steady-state estimates of choice based on several sessions (Baum et al., 1999). The regression line shows the relation between log (base 2) behavior ratio (allocation) and log (base 2) food ratio. The slope of 0.8 shows undermatching.

