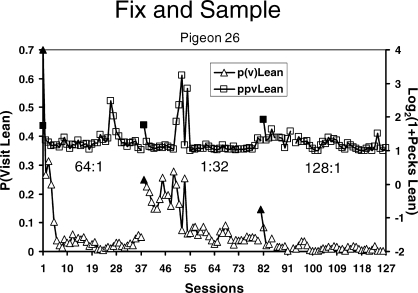
Fig 9.
The same data from Baum et al. (1999) as in Figure 5 replotted to show session by session the average number of pecks in a visit to the lean key (squares; vertical axis on the right) and the probability of visiting the lean key (triangles; vertical axis on the left). Pecks per visit (vertical axis on the right) was transformed by adding one and taking the logarithm. Filled symbols show the first session of a new condition. The brief visits to the lean key and the graded probabilities of visiting the lean key are consistent with a fix-and-sample pattern of responding on the two keys.

