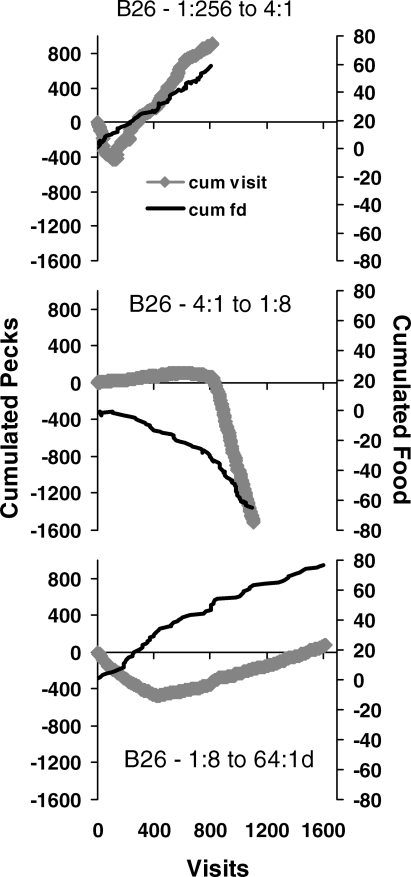
Fig 11.
The same data as in Figure 10 replotted to show the relatively abrupt transition in switching pattern. The lighter line shows cumulated food (vertical axis on the right) calculated by adding +1 for a food delivery from the left key and −1 for a food delivery from the right key. The line begins at zero, and the slope shows which was the richer alternative. The thicker line (diamonds) shows cumulated pecks calculated by adding the pecks in each visit to the left key and subtracting the pecks in each visit to the right key. In each session, cumulated pecks initially has a slope appropriate to the prior condition and then switches abruptly to a slope in the same direction as the cumulated food.

