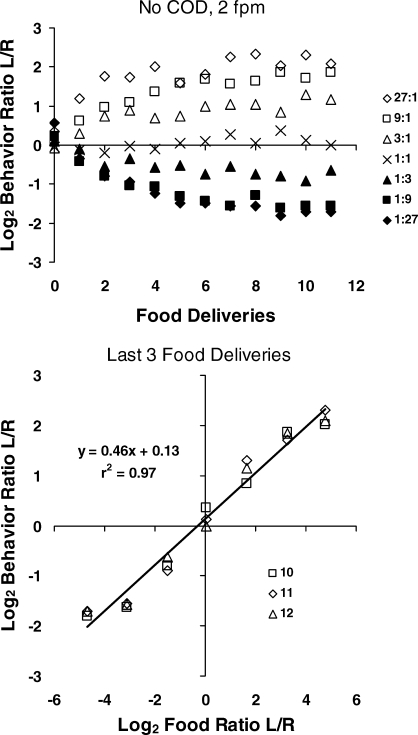
Fig 12.
Within-component choice, calculated for each interfood interval, from one condition of the experiment reported by Baum and Davison (2004). Top: As more food deliveries occur, choice moves from indifference toward a level appropriate to the food ratio in the component. Bottom: Log behavior ratio (last three points in the upper graph) plotted against log obtained food ratio across the seven components. The regression line fits the points closely but shows considerable undermatching at the end of the components.

