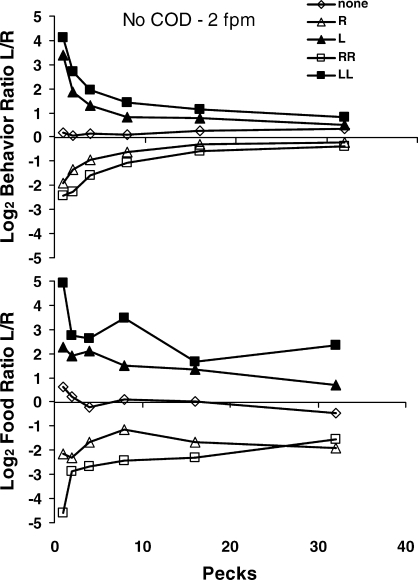
Fig 13.
Choice dynamics following food delivery in the Baum and Davison (2004) experiment. Top: Peck-by-peck choice following the beginning of the component (diamonds) and following one (triangles) or two (squares) food deliveries from the left key (filled symbols) or the right key (unfilled symbols). The first point represents all first pecks, the second point pecks 2 and 3, the third point pecks 4–7, the fourth point pecks 8–15, the fifth point pecks 16–31, and the last point all pecks beyond 32. Preference pulses appear following one or two food deliveries. Bottom: Log food ratio calculated from the occurrences of the next food following the beginning of the component (diamonds) or one or two food deliveries from the left or right key (same legend as the top graph). Food produced by each peck grouping on the horizontal axis was summed for the left and right keys and the ratio calculated. If food occurred again soon, it tended to be more often from the same key.

