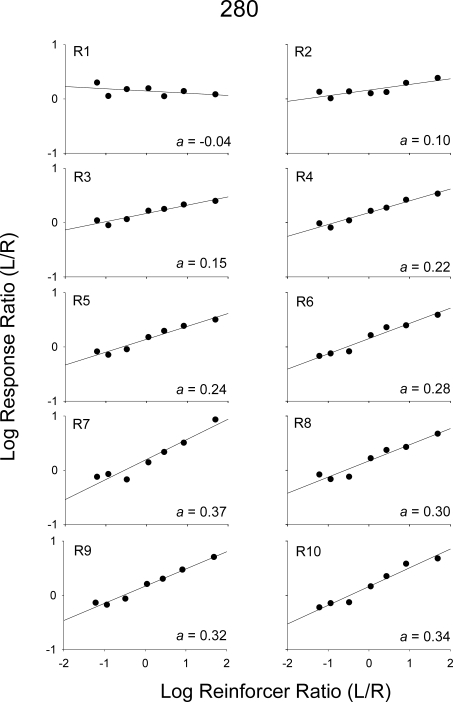
Fig 1.
Log response ratios (left/right) as a function of log obtained reinforcer ratios (left/right) aggregated across Sessions 16–50 for Pigeon 280. Each graph shows data from response ratios obtained prior to each reinforcer delivery denoted by R. Sensitivity estimates (a) for each data set are displayed in the bottom corner of each graph.

