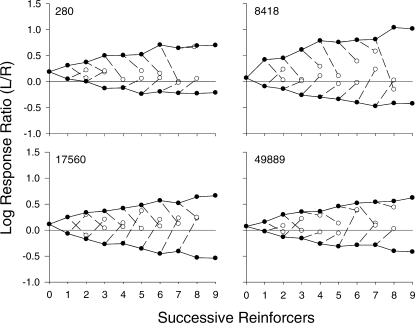
Fig 4.
Response trees for individual pigeons. Log response ratios (left/right) are plotted as a function of successive reinforcers delivered within a component aggregated across Sessions 16–50 for individual pigeons. Closed circles above 0 on the x-axis show log response ratios prior to the delivery of the first reinforcer and above 1 show log response ratios following the first reinforcer in a component (collapsed across all components). Subsequent closed circles show log response ratios as a function of consecutive continuations; open circles (dashed lines) show log response ratios following a single discontinuation, which followed a given number (x value) of continuations. Discontinuations following the eighth reinforcer (Pigeons 8418, 17560, and 49889) and ninth reinforcer (all pigeons) are not shown because they rarely occurred. Note that the discontinuation data point following the eighth reinforcer from the left alternative for Pigeon 280 is partially occluded by the continuation data point.

