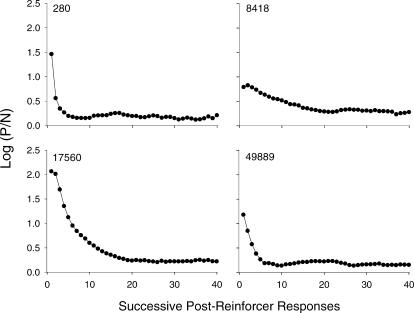
Fig 5.
Preference pulses for individual pigeons. Log (P/N) ratios are plotted as a function of ordinal position of the response up to the 40th response following a reinforcer. For each pigeon, data were aggregated across Sessions 16–50. “P responses” denote pecks on the option that just produced a reinforcer; the just-productive alternative; “N responses” denote pecks on the option that did not just deliver the reinforcer; the not just-productive alternative). These data were collapsed across components.

