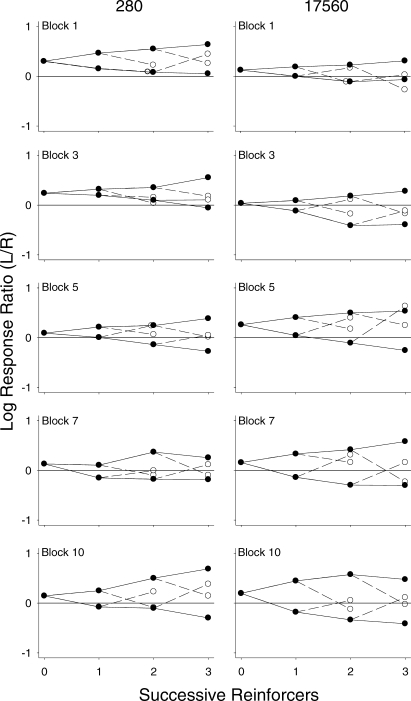
Fig 10.
Response trees for Pigeons 280 and 17560 across selected 10-session blocks across the experiment. In each graph, log response ratios (left/right) are plotted as a function of the first three reinforcers delivered within a component. Plotting conventions are the same as in Figure 4; this figure is laid out in the same fashion as Figure 9.

