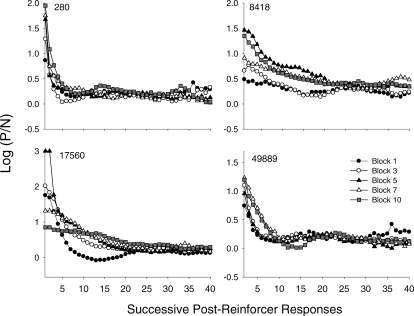
Fig 11.
Preference pulses for each pigeon for selected 10-session blocks across the experiment. Data for the separate blocks are denoted by different symbols. On two occasions (for Pigeon 17560 at the first two responses in Block 5), an exclusive preference occurred. In both cases, this involved between 600 and 700 “P” responses and 0 “N” responses; thus, a log ratio of 3.0 was assigned. Other features are as described in Figure 5.

