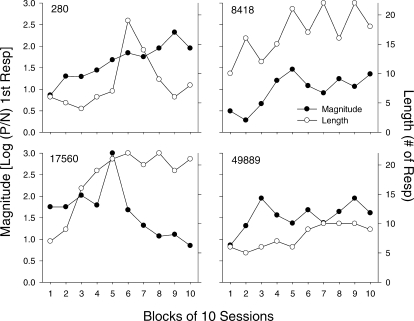
Fig 12.
The magnitude (closed circles) and length (open circles) of preference pulses for each pigeon as a function of session block. For each graph, the data for pulse magnitude are plotted on the left y-axis and the data for pulse length are plotted on the right y-axis. See Data Analysis for a description of the methods used to determine pulse magnitude and length.

