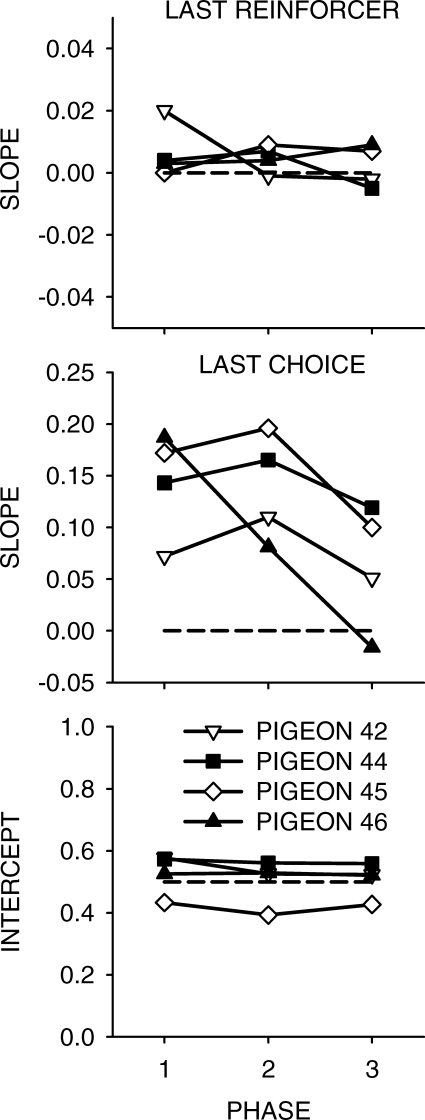
Fig 4.
The results of multiple linear regressions using choice in each interreinforcer interval as the dependent variable, and the location of the last reinforcer (a dummy variable of 1 [Left] or 0 [Right]) and the relative choice in the last interreinforcer interval as the independent variables. These fits were carried out using relative measures, rather than log-ratio measures, to allow the last-reinforcer variable to be properly specified. The dashed horizontal lines show zero in the top two graphs, and .5 in the bottom graph.

