Abstract
Charles Sherrington identified the properties of the synapse by purely behavioral means—the study of reflexes—more than 100 years ago. They were subsequently confirmed neurophysiologically. Studying reflex interaction, he also showed that activating one reflex often facilitates another, antagonistic one: successive induction, which has since been demonstrated in a wide range of species, from aphids to locusts to dogs and humans. We show a particularly orderly example in zebrafish (Danio rerio) larvae; the behavior (locomotion) of larvae is low in dark and intermediate in light, but low in light and substantially higher in dark when dark followed light. A quantitative model of a simple dynamic process is described that readily captures the behavior pattern and the effects of a number of manipulations of lighting conditions.
Keywords: dynamics, habituation, contrast, light, reflex, activity, zebrafish
Charles Sherrington, more than one hundred years ago, studied the reflexive behavior of a variety of decerebrate mammals. From his own work and the work of others he identified properties of individual reflexes, such as latency, habituation, and refractory period, that can be observed in all animal species. Sherrington also identified a number of properties of interaction between reflexes. One of the most interesting is successive induction, which is the facilitation of one reflex by the preceding excitation of an antagonistic one, e.g., “…the extension-reflex predisposes to and may actually induce a flexion-reflex, and conversely the flexion-reflex predisposes to and may actually induce an extension-reflex” (Sherrington, 1906; Staddon, 1983/2003)
Successive induction (also known as [successive] contrast) has subsequently been identified in a variety of species with a range of behaviors. In response to changes in illumination, for example, aphids (Aphis fabae) show antagonistic induction and antagonistic inhibition: under appropriate conditions, flight induced by light enhances the subsequent settling response, and settling reciprocally enhances the photokinetic flight response (Kennedy, 1965). A similar pattern of activity in response to change in illumination has been shown in locusts (Locusta migratory migratorioides: Moorhouse, Fosbrooke & Kennedy, 1978; see also Staddon, 1983/2003) and most recently in zebrafish larvae (Danio rerio: MacPhail, Brooks, Hunter, Padnos, Irons, & Padilla, 2009).
Sherrington's analysis of the properties of single reflexes led him to postulate the existence of the synapse, a junction between nerves with well-defined properties (for the history, see Cowan et al, 2001, especially p. 11 et seq.). These properties were subsequently confirmed neurophysiologically. But the process underlying successive induction has not been identified, and its physical basis has not been established. In this note we describe some new data on successive induction and a simple model of its operation that may help to identify the underlying physiology.
MacPhail et al. (2009) measured the movement of individual zebrafish larvae (6 days postfertilization [dpf]) separately housed in 96-well microtiter plates. The movement (cm/unit time) of each individual larva as a function of changes in the level of visible versus infrared light (perceptual dark) was recorded every 0.2 s, with a video-tracking system. The average data are extremely orderly and highly repeatable. The basic results are:
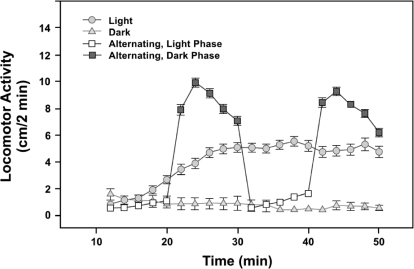
In the dark (infrared illumination only) not preceded by light, activity level is low and constant.
In the light, activity level slowly increases to an intermediate asymptote.
In dark preceded by a period of light, activity reaches a high level and then slowly declines. This is an example of successive induction: suppression of activity in the light facilitates activity in subsequent dark.
These properties are summarized in Figure 1, which shows the effect of continuous dark (triangles), continuous light (circles) and alternating light and dark (squares) on the activity level of three groups of zebrafish larvae.
Fig 1.
Successive induction in response to light changes in 6-dpf zebrafish larvae. Average activity level (measured as distance moved in 2-min periods) increases to an intermediate asymptote in continuous light (circles), rises to a high level then declines in the dark following a light period (solid squares), or stays at a low level in continuous dark (triangles) not preceded by light (experimental details in MacPhail et al., 2009). Each symbol represents mean ± SEM activity for 89–191 larvae. Reproduced with permission of the journal publisher.
THE PROCESS
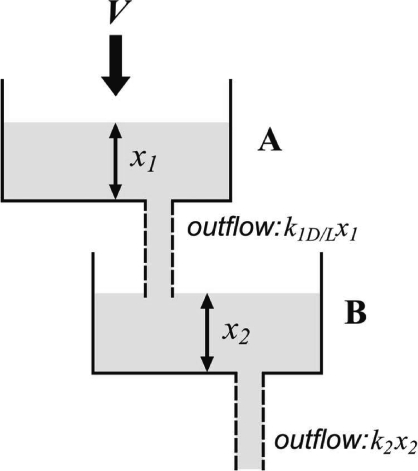
A process sufficient to generate these three patterns can be modeled by a system of two leaky reservoirs. First consider reservoir B in Figure 2 and let the water level in B, x2, represent activity level. In the light, activity slowly increases to an intermediate asymptotic value. This behavior can be modeled by B filling at a steady rate with an outflow determined by its level: the higher the level, the faster the outflow1, yielding an equilibrium level where inflow, V, is equal to outflow, k2x2, where x2 is the level and k2 is, in effect, the size of the leak. If inflow occurs only during light, we have then a simple model for behavior in the light (circles in Figure 1).
Fig 2.
A physical analog to successive induction. Level in reservoir B, ×2, corresponds to activity level. Reservoir A fills up at a steady rate V which is directly related to light level. A drains into reservoir B at a rate k1x1, which is determined by light level: k1 is small in the light and large in the dark. Reservoir B drains at a constant rate k2. Thus, in the light, A fills up. In subsequent dark, B rapidly fills (activity level rises) and then declines.
To capture successive induction, however, the inflow to B must be the outflow from a second (upstream) reservoir, A, which fills up only during the light, and mainly empties into B in the dark. The large activity (x2) increase observed in the dark after a period of light implies that inflow to B, in fact, comes from A, which fills at a steady rate (V, say) only during the light period.
If A empties only slowly in the light (k1L is small), it will fill up (level x1 will increase) during the light. The increase in activity in dark after a light period then corresponds to an increase in the A → B discharge rate in the dark (k1D ≫ k1L). In other words, A fills up in the light, but also leaks (slowly) into B, yielding the slow increase in B level (i.e., activity) in light. But in dark, the discharge rate from A → B increases, thus producing an increase in the level of B (i.e., an increase in activity). The increase in the level of B is transient, however, because V (inflow to A) is assumed to equal zero in the dark—so that A eventually empties, the flow into B ceases, and then B also empties (and activity declines toward zero).
This may seem complicated, but the physical analog in Figure 2 shows its essential simplicity. To reiterate, the process has the following ingredients:
x2 corresponds to observed activity level.
The inflow into reservoir A is at a constant rate V , that is positive when the light is on and zero when it is off.
A leaks into reservoir B at a rate proportional to its level, x1, and the setting of the valve (size of the leak) k1D/L, whose value depends on light level, large in dark, small in light: k1D ≫ k1L
B leaks at a rate proportional to its level, x2, and the size of the leak k2. k2 is constant.
The process is described more precisely by the following two linear difference equations:
where t is discrete time, V (inflow) is in effect a scale parameter and k1 takes on different values in the dark and light: k1D ≫ k1L, and V = 0 in dark and V > 0 in light.
TESTS
We look first at the qualitative fits between model and data and then look at more quantitative fits.
Qualitative Fits
Effects of constant light, dark, and light–dark alternation
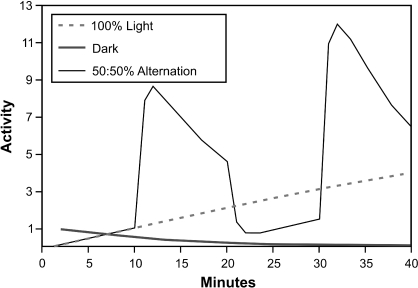
Figure 3 shows a simulation of the three conditions presented in Figure 1: constant dark, constant light, and 50∶50 alternation with a 20-min cycle. The general pattern—low to zero activity in constant dark, slowly increasing in constant light, and large-amplitude activity, high in dark, low in light, when light and dark alternate—is reproduced in the simulation.
Fig 3.
Qualitative fits: Simulation of the three conditions shown in Figure 1: constant dark (heavy line), constant light (dashed line) and 50∶50 alternation with a 20-min cycle duration (light black line). Parameters: V = 1, k1D = .08, k1L = .01, k2 = .8, x1(0) = 1. (Since the 3 curves in Figure 1 came from 3 separate experiments, slightly different parameter values would normally be needed for exact fits to each—but see discussion of Figure 7, below).
Preceding dark time has no effect
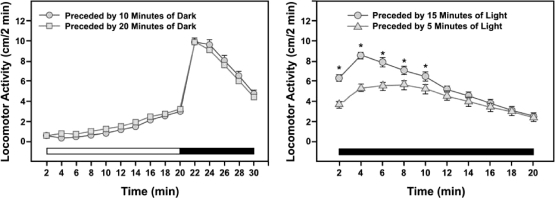
Figure 4 (left panel) shows data from two experiments in which the larvae were exposed to 20 min of light preceded by either 10 min or 20 min of dark, and followed by 10 min of dark. The curves are identical, showing (a) the high replicability of the data with this preparation; (b) successive induction: activity in the dark is elevated by prior light, and (c) duration of the initial dark period has no effect, which is as the model predicts because inflow, V, is zero in the dark.
Fig 4.
Left panel: Lack of effect of two different prior dark periods on subsequent light and dark activity. Right panel: Effect of light-period duration (longer light yields more activity in subsequent dark). Horizontal bars in both panels indicate periods of light (unfilled) and dark (filled). Each symbol represents mean ± SEM activity for 183–188 larvae. From MacPhail et al. (2009). Reproduced with permission of the journal publisher.
More light yields more activity in subsequent dark
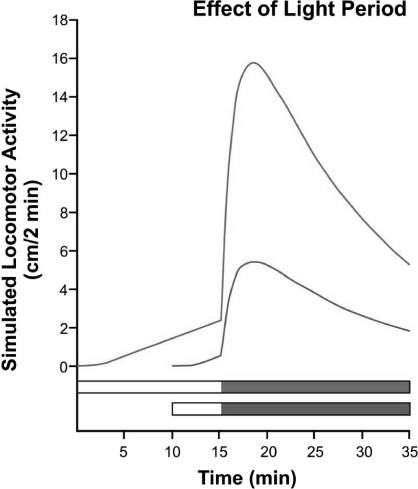
Figure 4 (right panel) shows activity in 20 min of dark preceded by either 5 or 15 min of light. There is more activity in the dark when preceded by a longer light period, as the model predicts: x1 will be larger after more light time. Figure 5 shows a simulation of this experiment. The pattern is the same, more light yields more subsequent activity, but the peak of the 15-min-light line is roughly 3 times higher than the 5-min peak, rather than about 1.5 times higher, as in Figure 4 (right panel).
Fig 5.
Effect of light-period duration (simulation of results in right panel of Figure 4). Parameters: V = 5, k1D = 0.2, k1L = 0.04, k2 = 0.9; initial conditions: x1(0), x2(0), both set equal to 0. Peak ratio is proportional to prior light-duration ratio. Horizontal bars indicate periods of light (unfilled) and dark (filled).
Quantitative Fits
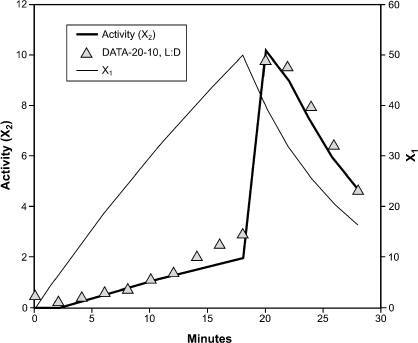
Figure 6 shows successive induction in 20 min of light followed by 10 min of dark (triangles); the heavy black line shows a simulation of activity level (x2, the level of reservoir B in Figure 2), for which the parameter values were fitted by inspection. The model readily captures the approximately linear increase in activity in the first 20 min of light as well as the rise-and-fall in subsequent dark. The light black line (right-hand y-axis) shows the value of x1, the level in reservoir A in Figure 2: x1 increases in the light and then declines rapidly in the dark, in the opposite direction to x2.
Fig 6.
Effect of 20-min light on activity in subsequent dark. Activity (triangles) increases approximately linearly in light then increases rapidly and declines in the dark. Data are means for 93 larvae. The simulation (bold line) used the following parameter values: V = 5, k1D = 0.2, k1L = 0.04, k2 = 0.9, initial conditions: x1(0), x2(0), both set equal to 0. Thin line shows changes in x1 (see right axis) in light, then dark.
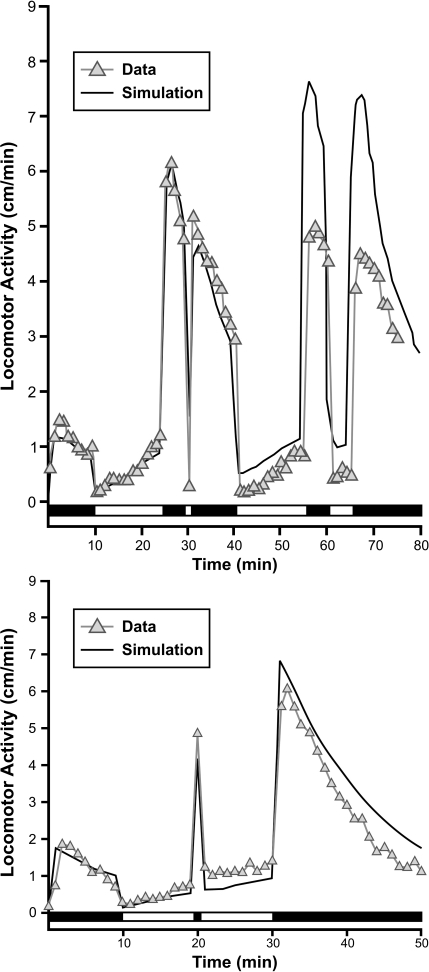
Figure 7, top panel, shows a quantitative fit to a complicated light–dark series, shown by the white–black bar at the bottom. Note particularly the sharp response to a single, brief (60-s) light period (at 30 min). Figure 7, bottom panel, shows the reverse effect—of a brief dark period (at 20 min). The parameters for both fits are the same, only the initial conditions are different, due to a burst of activity, which corresponds to x1 > 0 (i.e., a nonzero initial condition), from unspecified causes. (Like any real-time—dynamic—model, it is necessary to specify initial conditions for all the variables; we usually set x2 = 0 and x1 = 0 or a small positive value). Both graphs show that the fit is good for the first 30–40 min, although the model tends to overpredict activity in the latter portions of the experiments.
Fig 7.
Top panel: Effect of repeated light and dark periods on activity level (triangles) and simulation (line)—note the effect of a brief light period at 30 min and a longer light period beginning after 60 min. Bottom panel: Effect of repeated light and dark—note the effect of a brief dark period at 20 min. Horizontal bars in both panels indicate periods of light (unfilled) and dark (filled). Parameters for both simulations (bold line) were: V = 5, k1D = .07, k1L = .01, k2 = .8. Initial conditions were x1(0) = 15 for the top graph and 20 for the bottom (to account for the initial burst of activity due to unmeasured effects); x2(0) = 0 for both. Each symbol represents mean activity for 93–96 larvae.
DISCUSSION AND CONCLUSION
The average activity patterns caused by light–dark changes in this novel procedure are highly replicable. Moreover, the process represented by Equations 1 and 2 captures the essentials of the effect of light and dark on activity in zebrafish larvae, at least for the first 30–40 min or so of the experiment. Once the procedure was completely standardized (i.e., results perfectly replicable with successive groups), as it was for the two separate experiments shown in Figure 7, the same simulation parameter values seem to apply for any on–off input sequence.
The model fails, however, in two respects. First, the difference between the relative peaks on return to dark, in Figures 4 (right panel) and 5, shows that the assumption that x2 is directly related to measured activity level is too simple; simulated activity level (x2) increases too much with additional time in prior light. This discrepancy is independent of particular parameter values. It is a consequence of the linearity of the model, which can be alleviated in at least two ways. A model closer to the physical reality (see footnote 1) would improve the fit to the data in Figure 4, but at the cost of adding another parameter and making the equations more complicated. A second possibility is to recognize that for a comprehensive model it is both plausible (activity surely does have an upper limit) and necessary to include a nonlinear limiter for rate (or output). In other words, some negatively accelerated function relating x2 to actual activity is needed.
A more important problem is that the model overpredicts dark activity in the latter part (> 35 min) of the two experiments shown in Figure 7. This discrepancy also cannot be eliminated by changing parameter values without impairing the fit earlier in the experiments. Because predicted and actual activity levels are high at the end of these experiments, a rate-limiting assumption for x2 would improve the model fit here somewhat but would not account for these longer-term effects. The data in Figure 7 (top panel) and other data just now being gathered hint at a third process that reduces the effects of light and dark over tens of minutes of exposure.
Our aim at this stage, however, is not so much to provide a necessarily complex model that fits every detail as to expose the essential process that seems to underlie successive induction in these experiments. That process clearly involves a hidden variable (x1) that increases during time in the light and then facilitates activity in subsequent dark in a fashion consistent with a depleting reservoir. The relative simplicity of the process, like the simplicity of the synapse as originally described by Sherrington, suggests a comparably simple underlying physiology. We look forward to new research at the neural and molecular levels that might elucidate further these striking effects.
Acknowledgments
JERS thanks Duke University for research support and the University of York (UK) for hospitality during the preparation of this report. The authors thank Beth Padnos, Brenda Proctor and Dr. David Kurtz for maintenance and upkeep of the zebrafish colony and Deborah Hunter for the video-tracking analysis of the zebrafish locomotion.
This manuscript has been reviewed by the National Health and Environmental Effects Research Laboratory of the U.S. Environmental Protection Agency and approved for publication. Approval does not signify that the contents reflect the views of the Agency, nor does mention of trade names or commercial products constitute endorsement or recommendation for use.
Footnotes
Jack Marr has pointed out that in a real reservoir outflow rate is proportional to the square root of depth, but for simplicity, and because it makes no fundamental difference to the system properties, Equations 1 & 2 assume simple proportionality.
REFERENCES
- Cowan W.M, Südhof C, Stevens C.F, editors. Synapses. Baltimore: Johns Hopkins University Press; 2001. (Eds.) [Google Scholar]
- Kennedy J.S. Coordination of successive activities in an aphid: reciprocal effects of settling on flight. Journal of Experimental Biology. 1965;43:489–509. doi: 10.1242/jeb.41.4.805. [DOI] [PubMed] [Google Scholar]
- MacPhail R.C, Brooks J, Hunter D.L, Padnos B, Irons T.D, Padilla S. Locomotion in larval zebrafish: influence of time of day, lighting and ethanol. NeuroToxicology. 2009;30:52–58. doi: 10.1016/j.neuro.2008.09.011. [DOI] [PubMed] [Google Scholar]
- Moorhouse J.F, Fosbrooke I.H.M, Kennedy J.S. “Paradoxical driving” of walking activity in locusts. Journal of Experimental Biology. 1978;72:1–16. [Google Scholar]
- Sherrington C.S. The Integrative Action of the Nervous System. New Haven: Yale University Press; 1947. (Original work published 1906.) [Google Scholar]
- Staddon J.E.R. Adaptive Behavior and Learning. Cambridge University Press; 1983/2003. http://psychweb.psych.duke.edu/department/jers/abl/TableC.htm. [Google Scholar]


