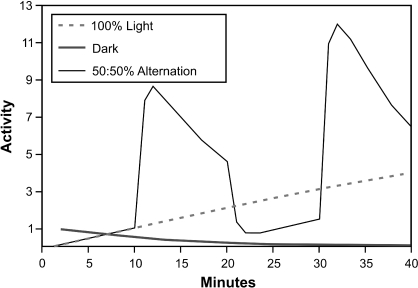
Fig 3.
Qualitative fits: Simulation of the three conditions shown in Figure 1: constant dark (heavy line), constant light (dashed line) and 50∶50 alternation with a 20-min cycle duration (light black line). Parameters: V = 1, k1D = .08, k1L = .01, k2 = .8, x1(0) = 1. (Since the 3 curves in Figure 1 came from 3 separate experiments, slightly different parameter values would normally be needed for exact fits to each—but see discussion of Figure 7, below).

