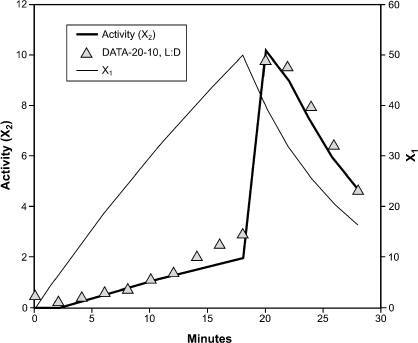
Fig 6.
Effect of 20-min light on activity in subsequent dark. Activity (triangles) increases approximately linearly in light then increases rapidly and declines in the dark. Data are means for 93 larvae. The simulation (bold line) used the following parameter values: V = 5, k1D = 0.2, k1L = 0.04, k2 = 0.9, initial conditions: x1(0), x2(0), both set equal to 0. Thin line shows changes in x1 (see right axis) in light, then dark.

