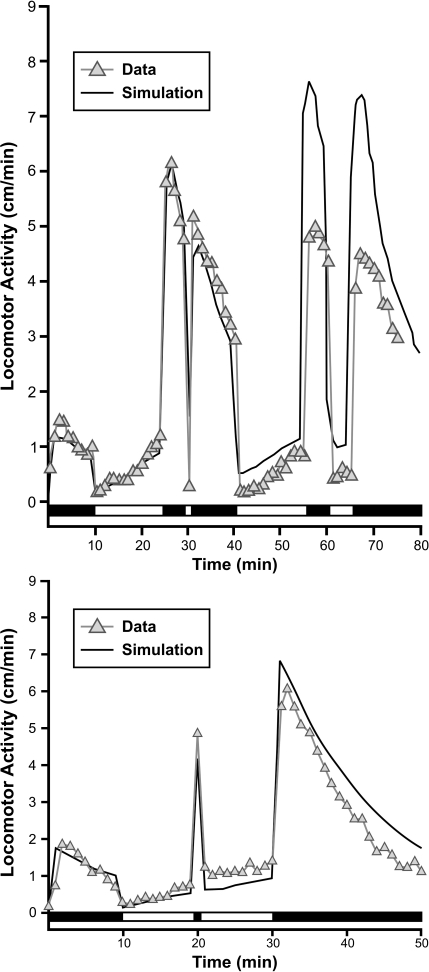
Fig 7.
Top panel: Effect of repeated light and dark periods on activity level (triangles) and simulation (line)—note the effect of a brief light period at 30 min and a longer light period beginning after 60 min. Bottom panel: Effect of repeated light and dark—note the effect of a brief dark period at 20 min. Horizontal bars in both panels indicate periods of light (unfilled) and dark (filled). Parameters for both simulations (bold line) were: V = 5, k1D = .07, k1L = .01, k2 = .8. Initial conditions were x1(0) = 15 for the top graph and 20 for the bottom (to account for the initial burst of activity due to unmeasured effects); x2(0) = 0 for both. Each symbol represents mean activity for 93–96 larvae.

