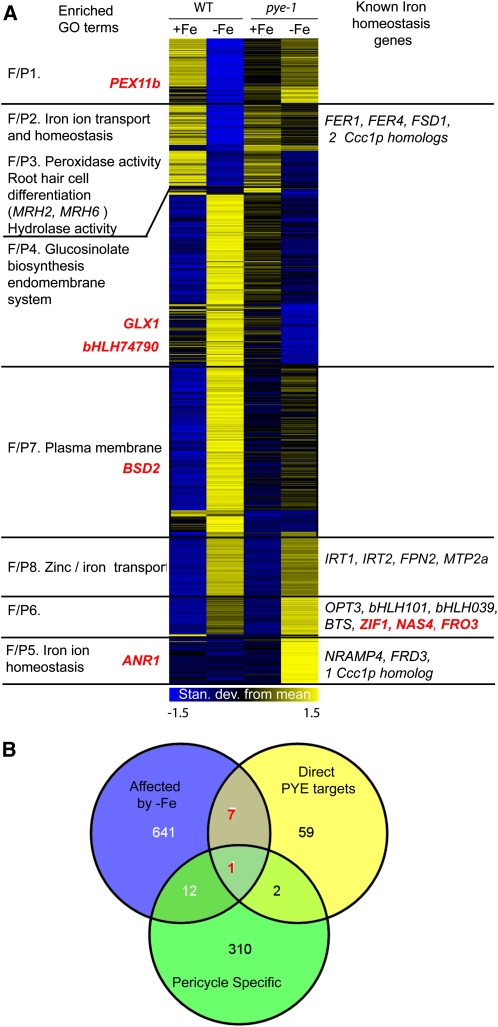
Figure 5.
PYE Transcriptional Regulation of Iron Homeostasis Genes.
(A) Heat map of all 661 genes affected by –Fe in wild-type (WT) roots and pye-1 roots or between wild-type and pye-1 plants under +Fe or –Fe conditions. Genes coregulated by Fe and/or pye-1 (F/P clusters) have similar expression patterns. Left, enriched GO categories associated with each F/P gene cluster. Right, individual genes known to play a role in responding to iron deficiency or involved in iron homeostasis. Direct PYE targets are indicated in red.
(B) Overlap of PYE direct targets based on ChIP-on-chip target analysis, 661 genes affected by –Fe and/or pye-1, and pericycle-specific transcripts. The number of PYE targets that are affected by –Fe are indicated in red.

