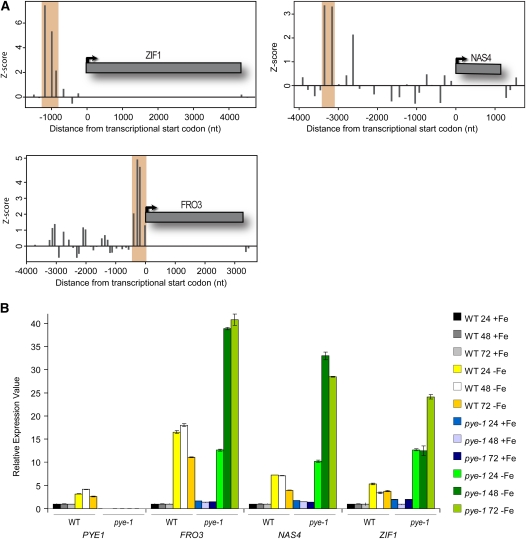
Figure 6.
PYE Target Binding Sites and PYE-Mediated Transcriptional Regulation.
(A) PYE binding signatures as shown by averaged Z-scores of probe enrichments from ChIP-on-chip experiments (y axis). Genomic positions (x axis) are given relative to the annotated transcription start of the gene. Shaded areas indicate genomic regions that were detected as enriched.
(B) qRT-PCR analysis of PYE and PYE direct targets after 24, 48, and 72 h of exposure of the wild type (WT) and pye-1 to +Fe or –Fe (±sd).

