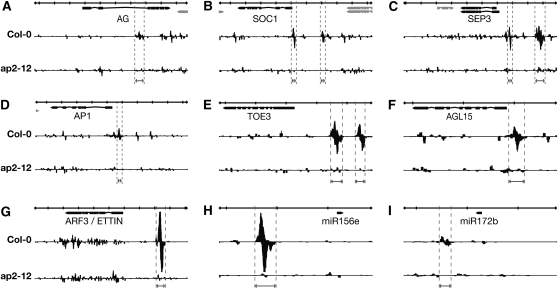
Figure 4.
ChIP-Seq Reveals Direct AP2 Targets.
GBrowse traces of mapped ChIP-seq reads. In each panel, the top row indicates scale, with bold vertical lines indicating 1-kb increments. Gene models are shown under the scale bar, and single biological samples are pictured below. Forward reads are mapped above each line and reverse reads below. Regions adjacent to or inside introns of AG, SOC1, SEP3, AP1, TOE3, AGL15, ARF3, miR156, and miR172 are bound with high confidence (FDR < 10−10) in both biological replicates versus control samples in the ap2 mutant line. Vertical dotted lines delimit the position of the peak regions.

