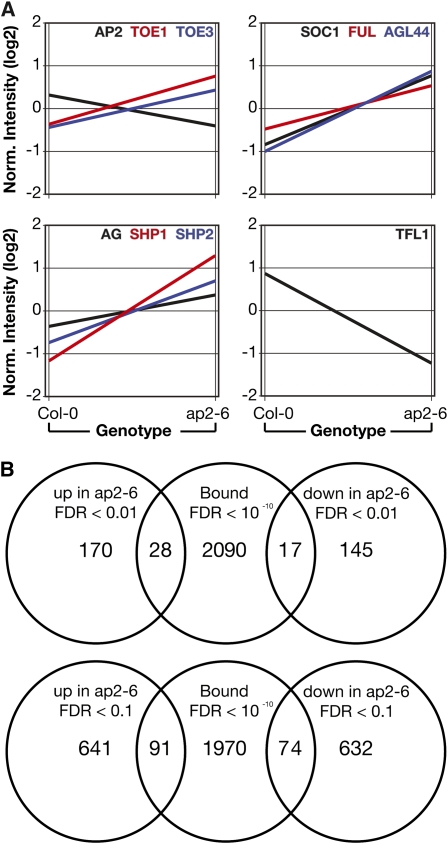
Figure 5.
Overlap of Genome-Wide Binding and Expression.
(A) Gene expression changes in ap2-6 influorescences as determined by Affymetrix microarray analysis.
(B) Overlap of loci bound by AP2 (determined by ChIP-seq) with transcripts differentially expressed in ap2 mutants (from [A]). Top Venn diagram indicates transcripts changed at RankProducts pfp < 0.01, and bottom Venn diagram indicates transcripts changed at RankProducts pfp < 0.1.

