Figure 6.
AP2 Activates and Directly Represses Flowering Time Genes.
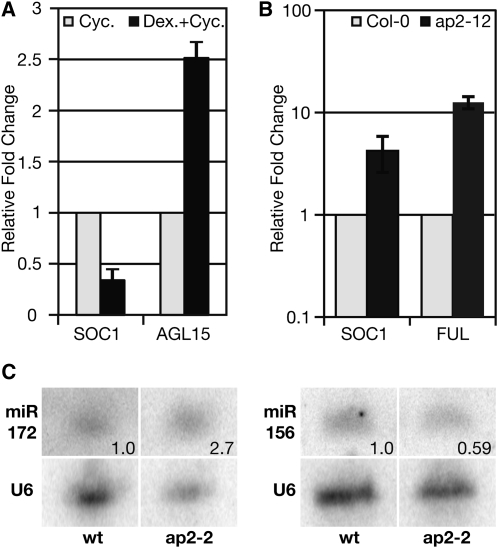
(A) Direct activation of AGL15 or repression of SOC1 was assayed by qRT-PCR in 35S:AP2m3-GR seedlings grown for eight LDs and treated with 10 μM CYC in the presence (black) or absence (gray) of 10 μM DEX. Data shown are representative of one biological replicate and three technical replicates from which sd was calculated. These data are representative of quadruplicate biological replicates, all of which showed similar results.
(B) SOC1 and FUL transcripts are upregulated in ap2 mutants undergoing the transition to flowering. Error bars indicate sd of triplicate biological replicates.
(C) miR172 and miR156 participate in a complex feedback loop with AP2. Small RNA gel blotting to detect miR172 and miR156 levels in wild-type versus ap2-2 dissected inflorescence tissue. The number on the gel images indicates normalized relative abundance of the small RNAs normalized to the loading control (U6). This assay was repeated twice with similar results.

