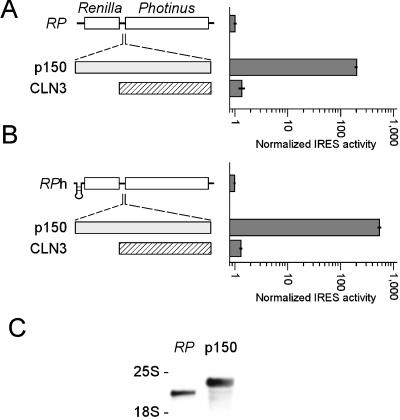
Figure 4.
Dicistronic analysis of S. cerevisiae p150 leader sequence. (A) Schematic representations of the RP, p150/RP, and CLN/RP dicistronic mRNAs are indicated. Experiments were performed and presented as in Fig. 2, with the exception that activities are represented on a logarithmic scale. Horizontal bars indicate SEM. (B) Dicistronic constructs with a hairpin structure at the 5′ end of the mRNA. (C) Northern blot of total RNA purified from cells transformed with the dicistronic constructs indicated and probed as in Fig. 1. The positions of the 25S and 18S rRNAs are indicated.

