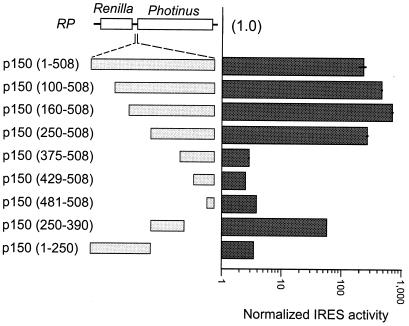
Figure 5.
Deletion and fragment analysis of the p150 IRES in S. cerevisiae cells. Schematic representations of the dicistronic constructs used in this analysis are indicated. Constructs are based on the RP vector; inserts include the full p150 leader sequence [p150 ()] in addition to 5′ deletions and fragments of this sequence. The construct designations indicate, in parentheses, the exact nucleotide sequences present in each construct. Cells were induced and IRES activities are represented as in Fig. 4. Values represent activities that have been normalized to those of the RP construct. Horizontal bars indicate SEM.

