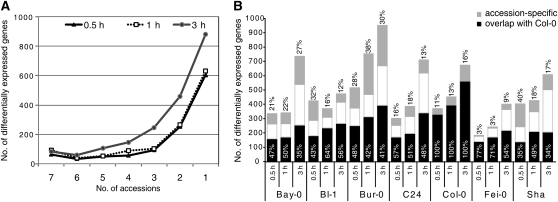
Figure 2.
Accession-Specific Differences in Auxin-Induced Transcriptional Changes.
(A) Differentially expressed genes with a significant (P < 0.05; Benjamini-Hochberg corrected) expression change of at least twofold (i.e., Δlog2 > 1) compared with untreated plants were categorized by the number of accessions in which they were differentially expressed.
(B) Bar plots show the number of differentially expressed genes in individual expression profiles. The fraction of genes that is specifically regulated in an individual accession is indicated in gray (black numbers), whereas the fraction of genes also differentially expressed in Col-0 is marked in black (white numbers).

