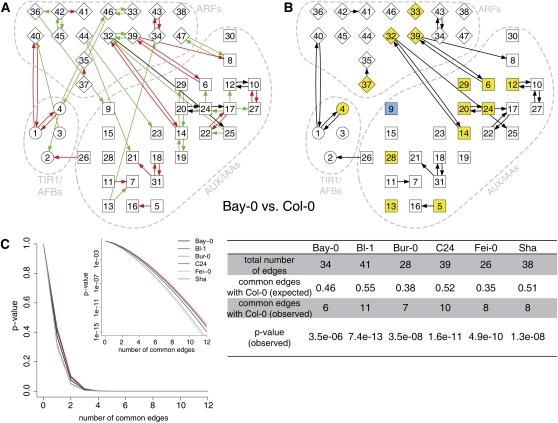
Figure 5.
Coexpression Analyses of Auxin-Induced Transcriptional Changes in Signaling Genes.
(A) Coregulation across time points of genes encoding TIR1/AFB auxin receptors (1–4, circles), AUX/IAA proteins (5–31, squares), and ARFs (32–47, diamonds) was analyzed by LCF. Red edges indicate connections detected specifically in the network of Col-0, green edges are specific for Bay-0, and black edges represent connections detected in both networks.
(B) Differences in auxin-induced changes for signaling genes at 1 hpi are highlighted in blue and yellow for significantly lower or higher transcriptional responses, respectively, in Bay-0 compared with Col-0 (P < 0.05, Benjamini-Hochberg corrected). A complete summary of pair-wise comparisons of LCF networks and time point–specific expression changes of all accessions is available as Supplemental Figures 9 to 11 online.
(C) Probability of the number of common edges between Col-0 (29 edges) and all other accessions. The plot shows probabilities of common edges, the inset shows identical data on a logarithmic scale, and the tabulated data are a summary of the results.

