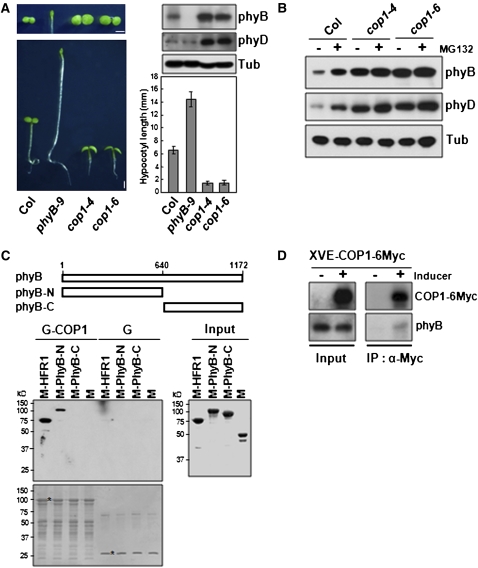
Figure 1.
phyB Interacts with COP1.
(A) Phenotypes of the wild type (Col), phyB-9, cop1-4, and cop1-6 under R light. Hypocotyls (bottom left panel) and cotyledons (top left panel) after R light treatment for 4 d. Bar = 1 mm. Bottom right panel: Average hypocotyl length ± sd (n > 40) for each genotype. Top right panel: phyB and phyD protein levels using anti-phyB (BA2) and anti-phyD antibodies, respectively. Tubulin (Tub) was measured as a loading control.
(B) Immunoblots showing phyB and phyD protein accumulation in cop1 mutants under R light. Four-day-old etiolated wild-type (Col) seedlings were treated with or without MG132 (25 μM) and exposed to R light for 24 h.
(C) In vitro pull-down assay showing interaction between PhyB-N and COP1. Top panel: Schematic diagrams of full-length PhyB, PhyB-N-, and PhyB-C-terminal region. Membrane staining (bottom blot) after pull-down assay was used to monitor amounts of bait proteins. Asterisks indicate the bait proteins GST-COP1 (G-COP1) or GST (G). Input, purified MBP-fused target proteins used in pull-down assays. HFR1 was used as a positive control. M, MBP
(D) In vivo pull-down assay showing interaction between phyB and COP1. Transgenic seedlings (XVE-COP1-6Myc) were incubated in the presence or absence of inducer to stimulate the expression of Myc-tagged COP1. Protein extracts (shown in Input lanes) were immunoprecipitated with anti-Myc (IP: α-Myc), and blots were probed with anti-Myc and anti-PhyB.
[See online article for color version of this figure.]

