Figure 9.
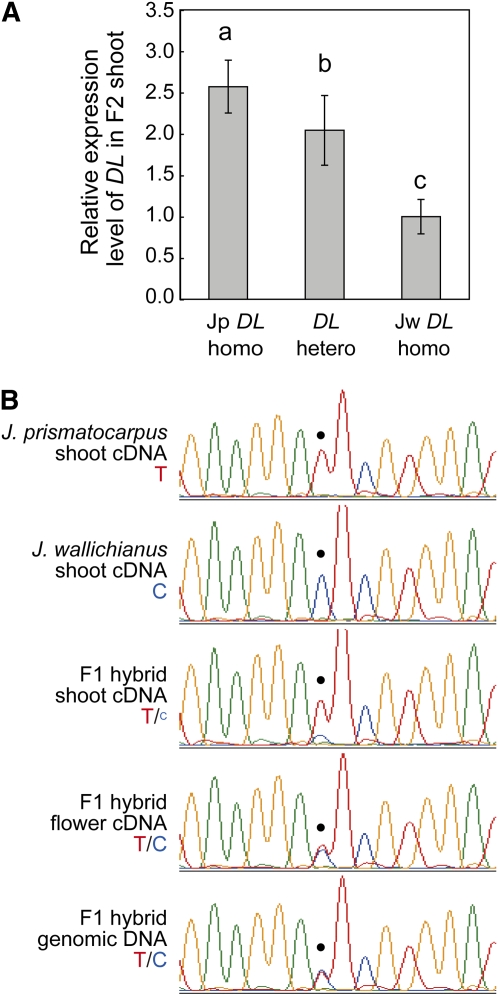
Expression Level of DL Depends on the DL Genotype in the Interspecific Hybrid.
(A) Quantitative real-time RT-PCR analysis of DL transcripts in the interspecific hybrid F2 generation of each DL genotype. Data (mean ± sd) are presented as relative expression units after normalization to a TUBULIN gene (n = 12). Different letters (i.e., a to c) above the columns indicate significant variations between the genotypes based on one-way ANOVA and Tukey’s HSD test (α = 0.05, with Bonferroni correction).
(B) Chromatograms of sequenced RT-PCR products, showing allele-specific DL expression in the interspecific hybrid F1 generation. Templates are indicated on the left. The dot indicates the position of a T (red) or C (blue) single nucleotide polymorphism between Jp DL and Jw DL.

