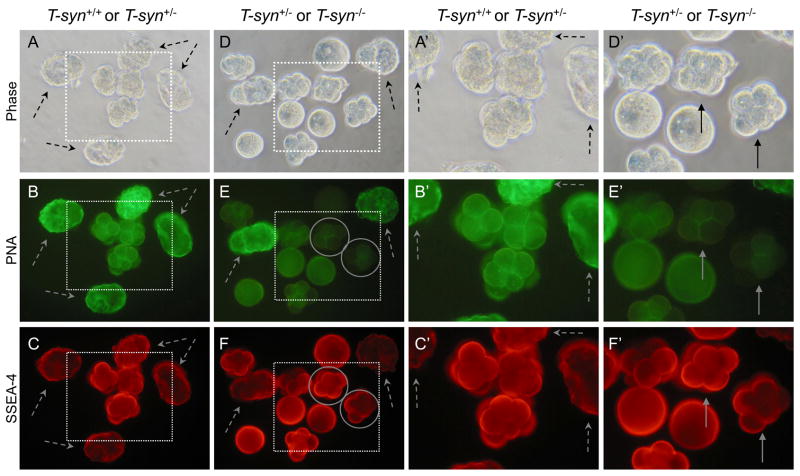
Fig. 6.
SSEA-4 expression on embryos from T-syn mutant females. SSEA-4-negative controls were late blastocysts that were included with both control and mutant embryo groups (dashed arrows). A. Phase contrast of control embryos obtained from T-synF/F females mated to T-syn+/− males. B. Control embryos from A binding PNA. C. Control embryos from A binding the SSEA-4 MAb. Only the early embryos fluoresced brightly. D. Phase contrast of embryos and blastocysts obtained from T-synF/F:ZP3Cre mutant females mated with T-syn+/− males. E. The same T-syn+/− and T-syn−/− embryos from D binding PNA. Early PNA-negative T-syn−/− embryos are circled. F. The same T-syn+/− and T-syn−/− embryos from D binding the SSEA-4 MAb. PNA-negative embryos are circled in panels E and F and identified by solid arrows in panels E′ and F′. A′-F′. The area marked by each dotted square in A-F is magnified. Images are at the same magnification and the same exposure. Solid arrows point to PNA-negative early embryos. Images are representative of 3 experiments with 2 eggs and 19, 4–8 cell embryos, half of the total generated by 6 control females and 4 eggs and 22, 4–8 cell embryos, half of the total generated by 6 mutant T-syn females.

