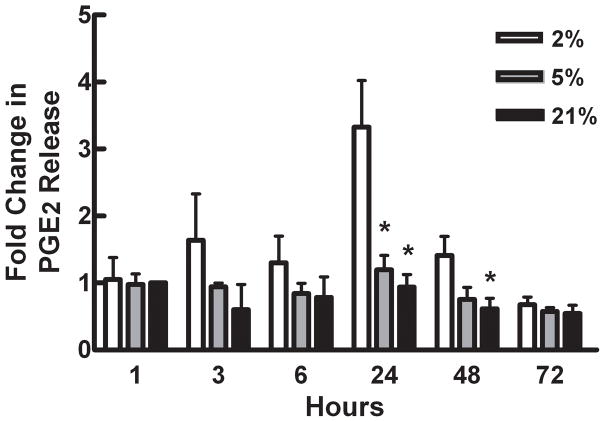
Figure 3.
Effects of hypoxia on PGE2 levels in MC3T3- E1 cells cultured for up to 72 hours in 2%, 5% or 21% O2. PGE2 levels were normalized to total cell protein for each sample. Bars represent mean fold increase in PGE2 levels ± SE, as compared to cells cultured in 21% O2 for 1hour. * Represents a statistically significant difference from 2% O2 at the same time point, p < 0.05, n=4.

