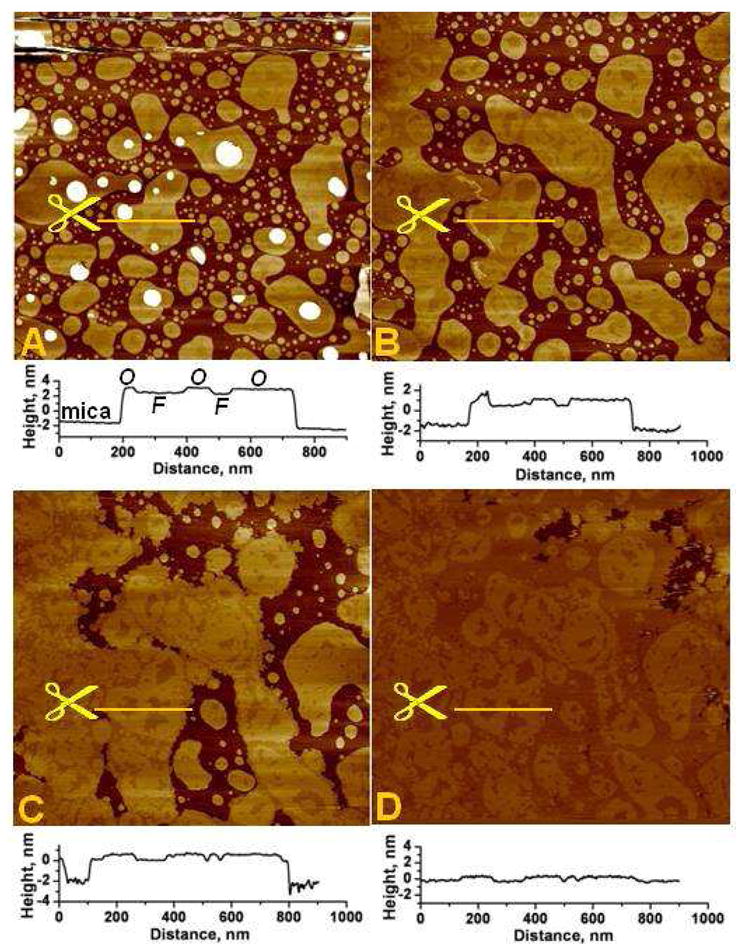
Fig. 1.

Supported PS bilayer undergoes phase reorganization upon addition of Rs1.
A. Typical PS bilayer patches prepared in 20 mM HEPES, 150 mM NaCl, 0.5 mM CaCl2 buffer. Following a brief period of equilibration, the patches and their phase configuration remained stable over several hours; shown here is the bilayer structure after about 2 hours of scanning. At the end of this period, the Rs1 solution was injected into the AFM fluid cell (four injections from initial concentration of 40 nM to the final concentration of 0.4 μM). The injection causes an imaging disturbance seen near the top part of the image which is scanned from bottom to top. White, circular, patches are “2nd level” bilayer patches overlying the bilayers attached to the mica (basal bilayers).
B – D. The same area 20 min, 2 and 2.5 hrs, respectively, after injection of Rs1; Note that the contours of the phases in image D repeat the contours of patches in image “B”. Images are 3×3 μm2.
Line plots under each image show section profiles along the lines drawn in yellow and indicated by the scissors in each corresponding image above. The sub-nm phase domain height differences are shown in these section profiles. The Ca2+-rich, ordered and the Ca2+-poor, fluid domains are respectively denoted by “O” and “F” on the line plot under image A. The total thickness of the bilayers is approximately 4nm.
