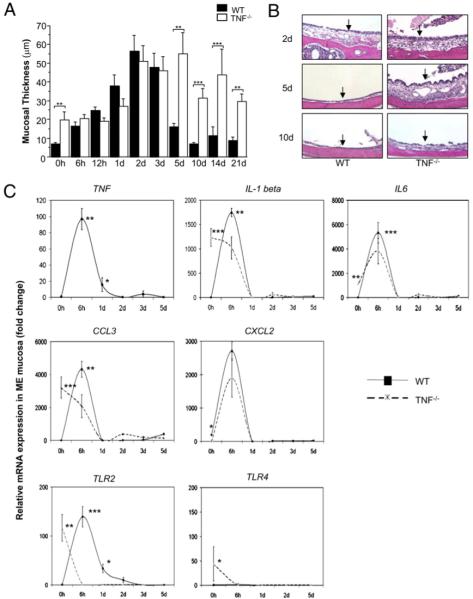
FIGURE 1.
TNF−/− mice develop persistent mucosal thickness and decreased initial inflammatory gene expression during NTHi-induced OM. A, Time course of mucosal thickness in response to NTHi in WT (closed bars) and TNF−/− mice (open bars). Results are expressed as means ± SEM of six MEs. B, Histologic changes in MEs of WT (left panels) and TNF−/− (right panels) mice at 2 d (top panels), 5 d (middle panels), and 10 d (lower panels) postinstillation of NTHi in the ME (original magnification ×100). Arrows denote mucosa. C, Relative mRNA expression measured by qRT-PCR of selected downstream cytokine/chemokine genes and TLR2 and TLR4 in ME mucosa prior to and post NTHi instillation into the ME of WT (solid lines) and TNF−/− (broken lines) mice. Target transcripts of WT and TNF−/− MEs were normalized to GAPDH and compared with uninfected mucosa of WT animals (0 h). Experiments were performed in triplicate and evaluated using two-way ANOVA and Fisher post hoc test with Bonforroni correction (*p < 0.05; **p < 0.01; ***p < 0.001, for this and subsequent figures).

